| Fractals |
Here is an example of a somewhat more elaborate Maple procedure than the one in the section on the 3x+1 problem. It plots a fractal image constructed by the iterated function scheme discussed by Michael Barnsley in his 1993 book Fractals Everywhere. Thanks to Simon Rentzmann, who included an example similar to this in his class project for fall 1995. For other treatments of the fern, see (for example) the following web pages.
After the code is an explanation of what it does.
(You can also look at analogous MATLAB
code. Incidentally, there is a popular
program Fractint to create
fractals on PCs.) Try copying the code into your Maple worksheet with the mouse
and executing the command
fractal(100); to get 100 points of a fractal image.
(The plot starts to look recognizable with about 400
points.)
fractal:=proc(n)
local Mat1, Mat2, Mat3, Mat4,
Vector1, Vector2, Vector3, Vector4,
Prob1, Prob2, Prob3, Prob4,
P, prob, counter, fractalplot,
starttime, endtime;
Mat1:=linalg[matrix]([[0.0,0.0],[0.0,0.16]]);
Mat2:=linalg[matrix]([[0.85,0.04],[-0.04,0.85]]);
Mat3:=linalg[matrix]([[0.2,-0.26],[0.23,0.22]]);
Mat4:=linalg[matrix]([[-0.15,0.28],[0.26,0.24]]);
Vector1:=linalg[vector]([0,0]);
Vector2:=linalg[vector]([0,1.6]);
Vector3:=linalg[vector]([0,1.6]);
Vector4:=linalg[vector]([0,0.44]);
Prob1:=0.01;
Prob2:=0.85;
Prob3:=0.07;
Prob4:=0.07;
P:=linalg[vector]([0,0]);
writedata("fractaldata", [[P[1],P[2]]], [float,float]);
starttime:=time():
for counter from 1 to n do
  prob:=rand()/10^12;
  if prob<Prob1 then P:=evalm(Mat1&*P+Vector1)
    elif prob<Prob1+Prob2 then P:=evalm(Mat2&*P+Vector2)
      elif prob<Prob1+Prob2+Prob3 then P:=evalm(Mat3&*P+Vector3)
        else P:=evalm(Mat4&*P+Vector4);
  fi;
writedata[APPEND]("fractaldata", [[P[1],P[2]]], [float,float]);
od;
fractalplot:=readdata("fractaldata",2);
print(plot(fractalplot, style=point, scaling=constrained,
           axes=none, color=green, title=cat(n, " iterations")));
fremove("fractaldata");
endtime:=time():
printf("Execution time was %a seconds.", endtime-starttime);
end:
 The mathematics underlying this code is the following iteration
scheme. Pick a vector in the plane and apply an affine
transformation (multiply by a matrix and add some vector to the
result). Plot the resulting point. Apply to the new point a
possibly different affine transformation. Repeat. In the given
example, there are four different affine transformations
involved, and the one that is picked at a given step is
randomized; each transformation has a specified probability of
being chosen at any particular step.
The mathematics underlying this code is the following iteration
scheme. Pick a vector in the plane and apply an affine
transformation (multiply by a matrix and add some vector to the
result). Plot the resulting point. Apply to the new point a
possibly different affine transformation. Repeat. In the given
example, there are four different affine transformations
involved, and the one that is picked at a given step is
randomized; each transformation has a specified probability of
being chosen at any particular step.
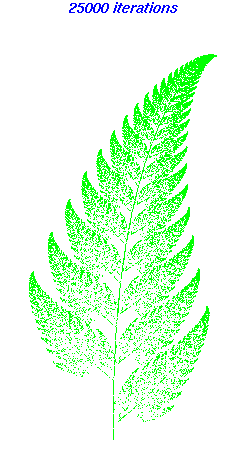
The final plot is thus a set of points in the plane, and because of the randomness, a different set each time the procedure is executed. The surprise is that for a large number of iterations, the final picture always looks the same.
This particular example is a fractal fern, shown in
the illustration for a large
number (25,000) of iterations.
Maple took about 17
minutes to compute this picture. The picture shown has the
plot symbol changed to SYMBOL=point, which improves
the image when many points are present.
Notice the self-similarity typical of fractals. Each leaf of the fern looks like a copy of the whole fern.
Now here is an explanation of what the Maple code does.
fractal to be the name
of a procedure that takes one argument n.
matrix
function is part of the linear algebra package; it could be
called by the name matrix instead of
linalg[matrix] if we first loaded the package via
with(linalg):. The next few lines of code set values
for the other three matrices, for the four constant vectors in
the affine transformations, for the probabilities of choosing
each affine transformation, and for the initial point.
writedata creates a
file named fractaldata if the file does not already
exist. If the file does exist, the command initializes the file
to contain only the data [0,0]. The subsequent call to
writedata[APPEND] in the loop appends the two
coordinates of the point P in floating point form to the
disk file fractaldata. It would be possible instead to
save the coordinates in a Maple array, but in my experience
that does not work well; Maple seems to have trouble
managing its memory for a large number of iterations.
od;.
rand function
generates a pseudo-random 12-digit non-negative integer.
Dividing by 1012 gives a random probability between
0 and 1.
fractalplot.
Exercise
Construct a Sierpinski
triangle by a similar algorithm.
Use three affine transformations with equal probabilities.
Each transformation has the same matrix
matrix([[0.5,0.0],[0.0,0.5]]);, but the vectors are
[0,0], [0,10], and [10,10].
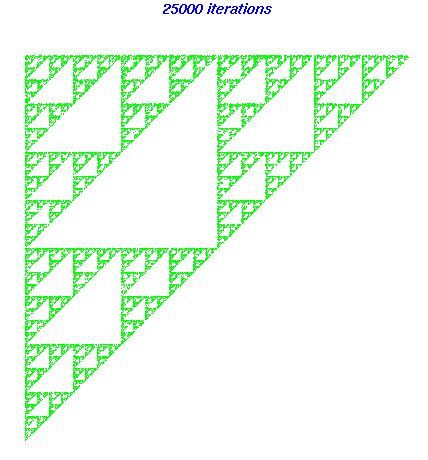 Your picture should look something like
the figure. (Try your
code first with a small number of iterations, to make sure that
your program is working properly.)
Your picture should look something like
the figure. (Try your
code first with a small number of iterations, to make sure that
your program is working properly.)
| Fractals |