- Move the cursor keys to the option that you would like and press
 .
.
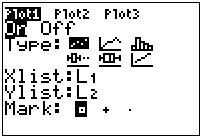
- To change the x-list move the cursor to that line and then press
 and then one of the numbers from 1 to 6. Above these keys are the list names: L1,... L6
The first time that you try to graph a scatter plot, you will need to setup the Stat Plot Menu. In order to make your life easier, always use the same list for the data points. Usually the x-values are put in L1 and the y-values are put in L2.
Setting up the Stat Plot Menu:
Notice in this picture, Plot1 is highlighted and thus is on. To turn it off(or on), move the cursor on top of Plot1 and press ![]()
Note: Always turn off the plots when you are graphing other functions. Not doing this can give you one of these errors: Invalid Dim or Dim Mismatch.
Once the stat plot menu is set up now you are ready to create the scatter plot.
Graphing the Scatter Plot