To shade a graph, you must first graph the function.
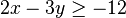
Example: Graph the feasible region.
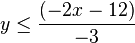
Note: There is no need to simplify the function beyond this since we are using the calculator to graph.
The screen on the left is the Y= menu and the screen on the right is the Window Menu, and the graph.
The symbols for lower shading is seen beside the Y4 and the symbol for upper shading is seen beside Y3 in this screen.
The next two screens show lower shading selected for our function and then the graph when the ![]() button is pressed.
button is pressed.
Example: Find the feasible region for this system of inequalities.

The screens show the results when using the method given above to graph both inequalities at the same time. The actual answer that you would show on your paper is the region that is shaded by both inequalities. Notice that more inequalities makes the screen more difficult to read.
Reverse Shading Method
The reverse shading method is to have the calculator shade the parts that you don't actually want. The advantage of this is that in the final graph, the region that is not shaded is the feasible region. The screens show the results when using reverse shading.